Timing Performance Tracking
The IMA.js server provides a built-in Timing Performance Tracking system that helps you monitor and optimize your server-side rendering performance. The system consists of two main components: TimingTracker for tracking metrics and instrumentEmitterWithTimings for automatic integration with the IMA.js event system.
Quick Start
Enable timing tracking with a single line of code:
// server/server.js
import { instrumentEmitterWithTimings } from '@ima/server';

instrumentEmitterWithTimings(emitter, {
  enabled: true,
  logToConsole: true,
  slowThreshold: 50, // Warn about operations taking longer than 50ms
});
That's it! The tracker is now available in all event handlers via event.context.timing.Best Practices
Overview
The timing tracking system provides:
- Automatic tracking of all IMA server events
- Context-based tracking - tracker available throughout the request lifecycle
- Timeline visualization - see exactly where time is spent
- Slow operation detection - automatically flag performance bottlenecks
- APM integration - export data to monitoring services like Datadog, New Relic
- Zero overhead - when disabled, tracking code is skipped entirely
Basic Usage
Automatic Tracking
Once instrumented, all IMA server events are tracked automatically:
import { instrumentEmitterWithTimings } from '@ima/server';

instrumentEmitterWithTimings(emitter, {
  enabled: true,
  logToConsole: true,
});

// No additional code needed - all events are tracked!
Manual Tracking
Track custom operations anywhere in your event handlers:
emitter.on(Event.Request, async (event) => {
  const { timing } = event.context;

  // Simple tracking
  timing.track('database.connect', { driver: 'postgres' });
  await connectToDatabase();

  timing.track('database.query', { table: 'users' });
  const users = await db.query('SELECT * FROM users');
});
Tracking Methods
The TimingTracker provides three methods for tracking timing:
1. track() - Manual Timestamps
Track individual events with optional metadata:
timing.track('operation.name', { metadata: 'value' });
Best for: Marking specific points in time, milestones.
2. start() / end() - Automatic Duration ⭐ Recommended
Automatically measure operation duration:
// Start timing
timing.start('database.query', { table: 'users' });

// ... perform operation ...
const users = await db.query('SELECT * FROM users');

// End timing - duration is automatically calculated
timing.end('database.query', { rows: users.length });
// Metadata includes: { table: 'users', rows: 42, duration: 15.23 }
Best for: Measuring operations with clear start and end points.
3. wrap() - Wrap Functions
Wrap functions for automatic tracking:
// Wrap the function once
const trackedQuery = timing.wrap('database.query', queryFn, {
  driver: 'postgres'
});

// Use it multiple times - each call is tracked automatically
const users = await trackedQuery('SELECT * FROM users');
const posts = await trackedQuery('SELECT * FROM posts');
Best for: Reusable functions that you want to track automatically.
4. measure() - Async Function Duration
Measure the duration of a function execution:
const result = await timing.measure(
  'fetch.users',
  async () => {
    const response = await fetch('/api/users');
    return await response.json();
  },
  { endpoint: '/api/users' }
);
Best for: One-time operations with inline functions.
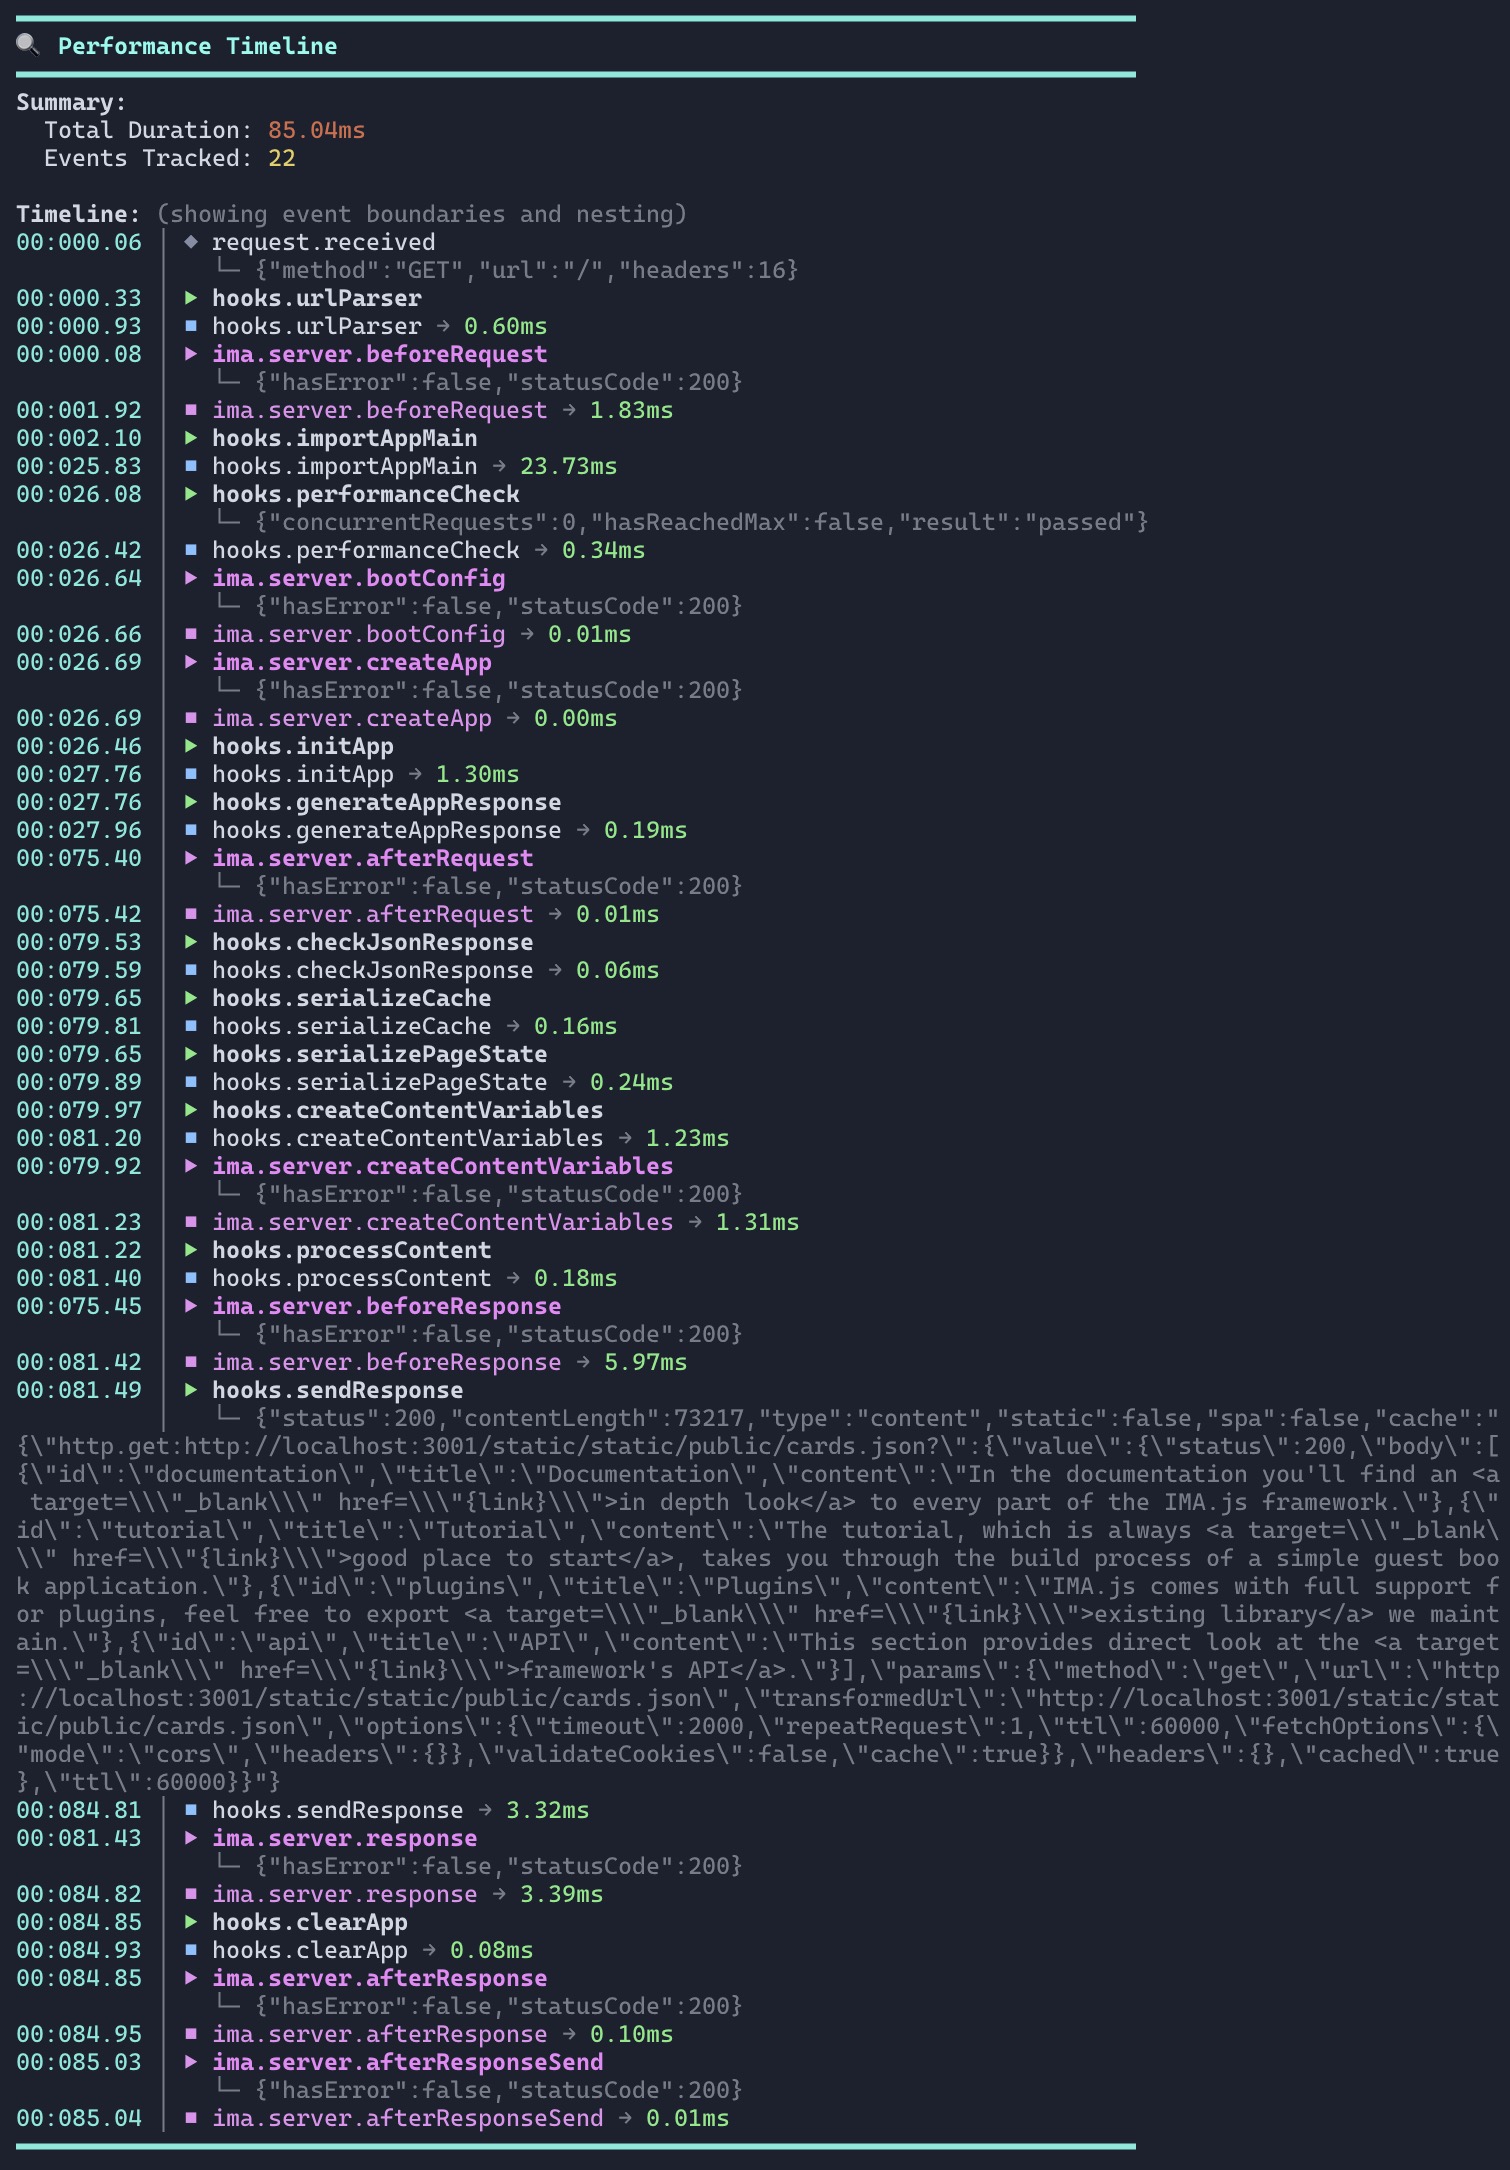
Console Output
The tracker provides color-coded timing performance timeline output:
━━━━━━━━�━━━━━━━━━━━━━━━━━━━━━━━━━━━━━━━━━━━━━━━━━━━━━━━━━━━━━━━━━━━━━━━━━━━━━━
Timing Performance Timeline
━━━━━━━━━━━━━━━━━━━━━━━━━━━━━━━━━━━━━━━━━━━━━━━━━━━━━━━━━━━━━━━━━━━━━━━━━━━━━━
Summary:
Total Duration: 123.45ms
Events Tracked: 15
Slow Events: 2 ⚠️
Timeline: (showing time each operation took)
├─ request.received: 0.12ms [@0.12ms]
├─ ima.server.beforeRequest: 1.23ms [@1.35ms]
├─ cache.get: 2.34ms [@3.69ms]
├─ database.query: 52.10ms [@55.79ms] ⚠️
│ [{"table":"articles","rows":150,"duration":52.10}]
├─ render: 38.90ms [@94.69ms]
│ [{"componentCount":42}]
└─ ima.server.afterResponseSend: 0.56ms [@95.25ms]
━━━━━━━━━━━━━━━━━━━━━━━━━━━━━━━━━━━━━━━━━━━━━━━━━━━━━━━━━━━━━━━━━━━━━━━━━━━━━━
⚠️ Slow Operations Detected:
• database.query: took 52.10ms
Reading the timeline:
- First number: Time the operation took (gap between events)
[@X.XXms]: Cumulative time since request start (dimmed)- ⚠️: Operation exceeded slowThreshold
Configuration
instrumentEmitterWithTimings Options
instrumentEmitterWithTimings(emitter, {
  // Enable/disable tracking
  enabled: true,

  // Sampling (1.0 = 100%, 0.1 = 10%)
  samplingRate: 1.0,

  // Console output
  logToConsole: true,
  logEvent: Event.AfterResponseSend, // When to log

  // Thresholds
  slowThreshold: 50,        // ms - warn about slow operations

  // Tracking options
  includeMetadata: true,    // Include metadata in reports

  // Auto-tracking
  autoTrackEvents: true,    // Auto-track IMA events

  // APM Integration
  useNativeMarks: false,    // Create native performance.mark()
  useNativeMeasures: false, // Create native performance.measure()

  // Callback when tracking completes
  onComplete: (report) => {
    // Send to monitoring service
    sendToDatadog(report);
  },
});
TimingTracker Options
When creating a tracker manually:
import { TimingTracker } from '@ima/server';

const tracker = new TimingTracker({
  enabled: true,
  slowThreshold: 50,
  includeMetadata: true,
  maxEvents: 1000,
  timestampPrecision: 2,
});
Real-World Examples
Example 1: Track Database Operations
emitter.on(Event.Request, async (event) => {
  const { timing } = event.context;

  // Wrap database functions for automatic tracking
  const trackedQuery = timing.wrap('database.query', db.query.bind(db));

  // Each call is tracked automatically
  const users = await trackedQuery('SELECT * FROM users');
  const posts = await trackedQuery('SELECT * FROM posts');
});
Example 2: Track Cache Operations
emitter.on(Event.Request, async (event) => {
  const { timing } = event.context;

  timing.start('cache.lookup', { key });
  const cached = await cache.get(key);

  if (cached) {
    timing.end('cache.lookup', { result: 'hit' });
    return cached;
  }

  timing.end('cache.lookup', { result: 'miss' });

  // Fetch and cache
  timing.start('data.fetch');
  const data = await fetchData();
  timing.end('data.fetch', { size: data.length });

  await cache.set(key, data);
});
Example 3: Track External API Calls
emitter.on(Event.Request, async (event) => {
  const { timing } = event.context;

  const result = await timing.measure(
    'external.api.call',
    async () => {
      const response = await fetch('https://api.example.com/data');
      return await response.json();
    },
    { service: 'example-api' }
  );
});
Example 4: Production Setup with Sampling
const isProd = process.env.NODE_ENV === 'production';

instrumentEmitterWithTimings(emitter, {
  enabled: true,
  logToConsole: !isProd,
  samplingRate: isProd ? 0.1 : 1.0,  // Track 10% in prod, 100% in dev
  slowThreshold: isProd ? 100 : 50,
  onComplete: isProd ? (report) => {
    // Send to monitoring service
    reportClient.timing('ima.request.duration', report.totalDuration);
    reportClient.gauge('ima.request.event_count', report.eventCount);

    report.events.forEach(event => {
      reportClient.timing(`ima.event.${event.name}`, event.gap);
    });

    if (report.slowEvents.length > 0) {
      reportClient.increment('ima.slow_events', report.slowEvents.length);
    }
  } : null,
});
Native Performance API
Enable native marks for APM agents:
instrumentEmitterWithTimings(emitter, {
  enabled: true,
  useNativeMarks: true,
  useNativeMeasures: true,
  onComplete: (report) => {
    // Native marks can be read by APM agents
    const marks = event.context.timing.getNativeEntries('mark');
    const measures = event.context.timing.getNativeEntries('measure');

    measures.forEach(measure => {
      client.recordTiming(measure.name, measure.duration);
    });
  }
});
Report Structure
The onComplete callback receives a detailed report:
{
  enabled: true,
  totalDuration: 123.45,        // Total request time (ms)
  eventCount: 15,               // Number of tracked events

  events: [                     // All tracked events
    {
      name: 'database.query',
      timestamp: 123.45,        // Absolute timestamp
      duration: 55.79,          // Cumulative time from start
      gap: 52.10,              // Time since last event
      metadata: {               // Custom metadata
        table: 'articles',
        rows: 150,
        duration: 52.10        // Included by start/end
      }
    }
  ],

  slowEvents: [                 // Events exceeding threshold
    { name: 'database.query', duration: 55.79, gap: 52.10 }
  ],

  thresholds: {
    slow: 50
  },

  request: {                    // Request context
    method: 'GET',
    url: '/articles/my-post',
    statusCode: 200,
    timestamp: '2024-01-01T00:00:00.000Z'
  }
}
Troubleshooting
Tracker not available in context
Make sure:
- You called
instrumentEmitterWithTimings()before events are fired - Your event is in the configured events list
- The first event (
BeforeRequest) has been fired
Console output not showing
Check that:
logToConsole: truelogEventmatches your last event (default:AfterResponseSend)- Events are actually being fired
Sampling not working
Ensure samplingRate is between 0.0 and 1.0:
1.0= 100% (track all requests)0.1= 10% (track 10% of requests)0.01= 1% (track 1% of requests)
See Also
- Server Events - IMA server event lifecycle
- Object Container - Dependency injection